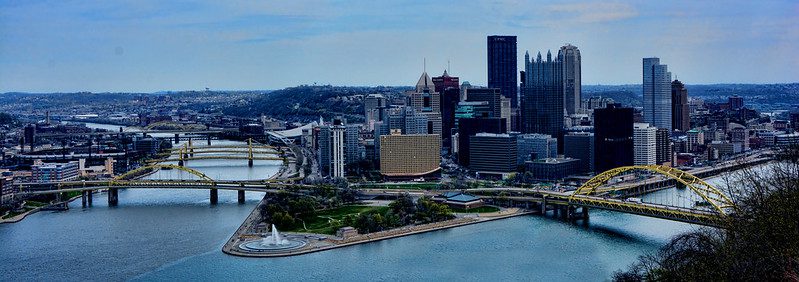
Photo by Mariano Mantel for Flickr, CC BY-NC 2.0
The U.S. Census Bureau recently released Income, Earnings, and Poverty Data from the 2007 American Community Survey, and with it announced a new class of America’s poorest big cities: Toledo, Memphis, Newark, St. Louis, Cincinnati, Pittsburgh, Buffalo, Miami, Cleveland, and Detroit.
Compare this with its ranking of America’s wealthiest locales: Plano, San Jose, Anchorage, San Francisco, San Diego, Virginia Beach, Seattle, Anaheim, Riverside, and Honolulu.
The factors behind these rankings may seem obvious. The wealthier cities are newer and farther west; the poorer cities are older and primarily located in the Rust Belt. The disabled and those unable to afford private transportation might have difficulty navigating Anaheim or Riverside, and a plane ticket to Hawaii can be out of reach for even middle-class Americans. Furthermore, those who rely on social services do well to avoid Alaska.
Civic leaders in the poorer cities demand changes in policy, encourage support for charity, blame the decline of the manufacturing sector, and attribute their rankings to large-scale immigration. And they’re right to note the prevalence of poverty among their cities’ residents, and to demand change.
But a nebulous factor makes comparing poverty across these cities more difficult than just comparing their rankings, and that factor is fragmented municipal governance.
Take Pittsburgh, America’s supposed fifth-poorest city, for instance. Nearly 56 square miles large, it’s no Wasilla, Alaska. Its population is around 300,000, and it sits in an urban county of almost 1.3 million people with an area of 745 square miles.
Compare this to San Diego, America’s supposed fifth wealthiest. The area of San Diego City is 372 square miles and is home to over 1.2 million people. San Diego County is 671 square miles and home to more than 3.1 million people. (As San Diego’s metropolitan area spans the Mexican border to include Tijuana, for the purposes of comparison we’ll neglect the fact that Pittsburgh sits in a seven-county metro area with over 2.1 million residents.)
It’s well-established that the poor both gravitate toward and are frequently unable to relocate from center cities due to the myriad factors that perpetuate residential segregation. It’s also well-established that many wealthy folks tend to locate on the ever-expanding suburban fringe. And in Pittsburgh’s case, the actual municipal boundaries of the City of Pittsburgh largely include only the center city — less than 8 percent of the surrounding urban county’s land area, and somewhere around 25 percent of the county’s population. Compare this to San Diego, which occupies more than half of San Diego County’s land area and holds almost 39 percent of its population.
Simply put, more residents of far-flung, affluent areas live within the actual municipal boundary of the City of San Diego than the City of Pittsburgh, because the City of San Diego has a wider, more inclusive boundary.
Mt. Lebanon, one of the former’s most prosperous neighborhoods, is a scant 5 miles from downtown Pittsburgh. It also is an entirely separate municipality. Mt. Oliver, though not one of Pittsburgh’s most prosperous neighborhoods, is also a completely independent municipality that lies entirely within the borders of the City of Pittsburgh. Here in the Rust Belt, we really, really like a proliferation of municipal governments — which tends to make us perform more poorly in rankings of center cities.
The Census rankings of America’s poorest and wealthiest counties gives a more accurate depiction of the dynamics of income in America, identifying suburban New York City, D.C., and San Francisco counties as America’s wealthiest, and pegging mostly Deep South and southwest border counties as America’s poorest. (As the cities of Baltimore and Philadelphia and the Bronx borough of New York City are technically incorporated as counties, these locales, though among America’s poorest counties, again do not offer an apples-for-apples comparison.)
Manipulations of municipal boundaries are a highly effective shell game that civic leaders play to distort rankings. Pittsburgh occupies the lowly position of America’s 59th largest city, in terms of population. Jacksonville, Fla., though sitting in a metro area of only 1.3 million — far fewer than Pittsburgh — has annexed a whopping 885 square miles of surrounding territory, technically making it America’s 12th largest city in 2007. Louisville, Kentucky, combined its city and county governments to become, technically, America’s 17th largest city, though its metropolitan area is roughly as large as Jacksonville’s.
The numbers don’t lie — the actual incorporated area of the City of Pittsburgh, is in fact, the fifth poorest incorporated area in the country. But, when those incorporated areas themselves don’t follow a standard definition, the rankings offer, at best, an incomplete and flawed comparison.


Comments