Later this week, I am going to be participating with my friend David Dixon and marketing whiz Laurie Volk in a seminar on development density at the annual meeting of the American Institute of Architects. Our session is titled “Making Density Work: Dollars, Design, and Sustainability – the Nuts and Bolts of Successful Density.” I think Laurie is “Dollars,” David is “Design,” and I am supposed to be “Sustainability.”
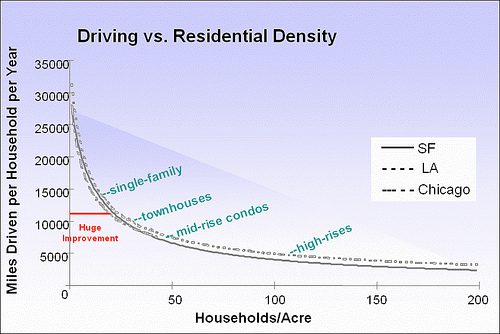
Which is fine with me. So, anyway, I have been pondering what it is that I want to say about density and sustainability. The research certainly suggests that it makes a difference. The graph accompanying this post compares residential units per acre to annual driving rates, as measured in Chicago, Los Angeles, and San Francisco. This graph has become somewhat of a classic in the field, representing research by John Holtzclaw, my NRDC colleague David Goldstein, and their partners at the Center for Neighborhood Technology.
What I find most intriguing, though, is not just the drop in driving rates but how much they drop as we change densities. Look at the shape of the curve. We get the greatest increments of performance improvement at the lower end of the scale, as we move from large-lot sprawl to smaller-lot single family homes and townhouses. By the time we reach typical multi-family densities, the curve really flattens out. On my NRDC blog today, I also feature a graph comparing neighborhood densities in Baltimore to driving rates, with very consistent results at the low end of the scale.
So increased density is associated with reduced driving, but we don’t need drastic lifestyle changes to realize significant benefits in reducing driving and associated global warming emissions.
But there’s also something else going on with density research. Neighborhood density works best when combined with synergistic elements such as location, transit service, connected streets, and mixed land uses.
In fact, without some of these elements, it won’t work very well at all. Almost all of the good density studies have been done at macro levels in places, or in areas that include places, that have been built for some time. And, in America, the density tends to be in the older parts of our cities and suburbs, most of it from the pre-sprawl era. Those are also the places that are centrally located, have smaller, well-connected blocks, shops and services nearby, and decent transit service. So the density studies are actually measuring more than density.
The most sophisticated work that I have seen that attempts to separate some of these elements from each other comes from the highly regarded transportation consultancy Fehr and Peers, as represented on another graph on my NRDC blog today. According to F&P, by far the most important factor in influencing travel behavior is not density per se but location, or more precisely something called regional accessibility, the distance from a given place (say, a residence) to other important places (jobs, shopping, entertainment, other residents) in the same metro region. This measure is highly favorable to central locations (including central areas in long-established suburbs).
But the other factors – density, mix of uses, walkability and street connectivity, and transit service – matter, too. Their effects are additive. Smart growth – or, if you prefer, smart urbanism – is not a principle, but a set of principles. The best results come when they are applied together, and that will be my message on Friday.
See my NRDC blog today for more details, links, photos, and graphs on the subject.


Comments