Many social scientists note that wealth is a superior measure of economic well-being and stability than income. Indeed, research shows that income and wealth are not very strongly correlated and tend to measure different social characteristics. A report from the Urban Institute says, “Wealth isn’t just money in the bank, it’s insurance against tough times, tuition to get a better education and a better job, savings to retire on, and a springboard into the middle class. In short, wealth translates into opportunity.” Moreover, while the racial income gap has closed significantly (even though it is still quite large), the racial wealth gap has widened in recent years, particularly following the “Great Recession” when the gap grew to a width unseen since the 1980s. Black households lost 30 percent of their wealth compared to only 11 percent for white households. Home equity accounts for a large amount of this wealth—about 56 percent for black people and 38 percent for white people; in both cases over twice as much as the second most prominent asset—and as such the country’s wealth tends to move with the housing market. Homeownership provides intergenerational economic security by offering tax deductions, increased access to credit, and a source of inheritance. In many ways homeownership can serve as a springboard to other types of asset acquisition, including vehicles, businesses, and even other properties. Relatedly, among homeowners, home values determine the actual amount of available home equity and can vary widely by racial group.
While home value is not a true measure of home equity, it offers a measure of potential and how it is racialized. It’s important to remember that racial differences in home value are only partially determined by the initial price of the home. That is to say that these disparities do not hinge only on economic capacity—the preexisting wealth and income gaps that determine people’s ability to purchase an expensive home. While this is certainly a factor, post-purchase housing appraisals can also play a major role in exacerbating racial differences. Homes in neighborhoods with high proportions of black people are consistently appraised at lower values than corresponding homes in neighborhoods with more white people, for two interrelated reasons. One is a long legacy of neighborhood disinvestment and environmental racism that leads black neighborhoods to be devoid of amenities such as quality parks and often nearer to hazards such as waste disposal facilities. The other is a stubborn historical aversion to living near black people, building on stereotypes that they’re loud and do not maintain their yards; this leads to homes near black people receiving worse appraisals simply because they’re near black people, regardless of the local neighborhood amenities.
With that in mind, tracking racial disparities in homeownership and home value over history allows us to examine changes, or lack of changes, in relative economic security and understand the durability of inequality over the long term. Mapping these statistical changes onto immediate political and social events offers a guide to how certain events serve to exacerbate or dampen inequality, or, indeed, not move it at all.
The American South has a unique history where both inequality and race are concerned. The predominant home of chattel slavery—in which economic and social inequality are stretched to their ultimate extremes—in the country, the region, in many ways, has yet to recover from such polarizing racial disparities. The region remains home to the highest rates of income inequality and poverty in the nation and houses a greater percentage of the nation’s poor—41 percent—than any other region by a wide margin. This history and contemporary economic turmoil combined with the region’s high concentration of black people—over 90 percent of the national total at its peak and around 55 percent today—make the South a particularly important place to concentrate an investigation of homeownership and home value. Not only does it give us a look at how racial inequality exists alongside general economic inequality and insecurity, but black people’s long residence in the region allow us to look at inequality from Emancipation to the modern day.
…
In the wake of Emancipation, the overwhelming majority of former Southern slaves were left with little more than a few meager clothes to claim as their personal property. Devoid of transportation, often separated from their families by great distances, and most lacking all but basic agricultural skills, they were forced to pull their lives together from nearly nothing across a South that had been ravaged by years of brutal warfare.
The newly established Freedmen’s Bureau was charged with the responsibility of helping the freed black people adjust to life outside of bondage, including securing employment and, where available, land. The Bureau was assisted by federal statutes such as the Southern Homestead Act and other legislation that encouraged redistributing former slave plantations among freedmen. Though the legislation only netted moderate successes at best and the landownership and wealth gaps between black and white Southerners remained large, black people managed to cobble together a fair amount of land at rates slightly higher than their white counterparts, peaking in places where illiteracy and tenant farming were comparatively low. But the Freedmen’s Bureau wasn’t necessarily a savior for black people. Understaffed and overworked, the Bureau often encouraged former slaves to take up residence and sign contracts with their former owners simply out of the convenience of brokering such deals. This inability, or refusal, to secure fair employment and land ownership for black people turned out to have lasting effects.
That period of relatively rapid land accumulation was short lived as Reconstruction quickly became what historians call Redemption, the period when Southern whites violently sought to reclaim their social and political power from the newly enfranchised free black population. Redemption ushered in the decades-long Jim Crow, characterized by formal segregation, violent oppression, economic exploitation, and a spike in black out-migration to the northern metropolitan areas. As Jim Crow droned on, black Southerners managed to pull together their own tradition of homeownership, often in tiny shacks hastily thrown together and/or haphazardly repaired with whatever materials were available, in segregated neighborhoods lacking modern amenities and social services.
Eventually, the Civil Rights Movement clawed its way to legal victories, such as Brown v Board of Education of Topeka in 1954, the Civil Rights Act of 1964, and the Voting Rights Act of 1965, formally ending the overt perniciousness of Jim Crow. This legislation seemingly expanded opportunities for black people, affording them increased access to quality education, jobs, and housing, which black people could conceivably use to close the racial gap in homeownership rates and home value in the following decades.
…
From 1870 until 2000, the United States Decennial Census collected data on home value. In addition to its standard data on homeownership, these offer the tools necessary to examine how racial differences in these two economic measures have remained durable over time.
Rather than measure and compare home value and homeownership rates separately, it is more productive to combine them into an aggregate measure of home value inequality. Doing this at the county level offers a metric for the relative economic security of communities. To that end, I measure aggregate home value for black people and white people by multiplying the homeownership rate—the proportion of owner-occupied housing units—for each racial group by the median home value in the county for that group.
This calculation yields a per capita estimate of home value that accounts for disparate homeownership rates as well as disparate home values and prevents the numbers from being artificially inflated by relatively equal homeownership rates but disparate home value or equal home value but dissimilar homeownership rates. For example, if the median home value for both whites and blacks in a county were $10,000, their respective cumulative home value may seem equal, but if the homeownership rates were 90 percent for white people and 70 percent for black people, including that reveals that average home value for each racial group is $9,000 and $7,000 respectively, meaning that white people in the county collectively have more potential home equity. (In 1870 there was no separate information on homeownership rates collected, just self-reported individual-level data on the value of total real estate owned, which I aggregated into their respective county units to include as a baseline.)
Using this calculation, I came up with a measure of home value inequality—a ratio of black per capita home value to white per capita home value, such that a value of .65 means that on average a black person in has 65 percent as much wealth from their home value as a white person. A value of 1 would indicate that wealth is equal.
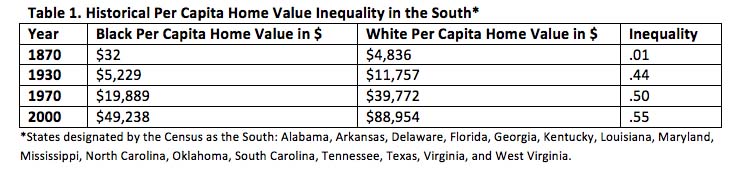
Inequality values at four historical points, beginning in 1870 and ending in 2000 when the Census stopped collecting home value data, are shown in Table 1 (above). All of the numbers are adjusted to 2015 dollars.
Racial differences in home value inequality have remained relatively stable for a long time. The disparity was understandably high in 1870 as former slaves struggled to establish lives from nothing. At the time, the value of black real estate was on average less than 1 percent of the value of white real estate, at $32 to $4,836, respectively. Over the next 60 years, black people made significant gains, eventually pulling their home value up to 44 percent of their white counterparts, but then progress slowed significantly. Over the next 70 years, the gap between black and white per capita home value decreased by only 11 percentage points, despite seemingly massive increases in the opportunities available to black people. In 1970, black home value was still 50 percent of white home value, and in 2000 it had only increased to 55 percent. White Southerners still boasted almost twice as much potential home equity despite substantial increases in educational and occupational opportunity for black Southerners over the past 150 years. At that rate, with the gap closing by only 11 percent every 70 years, it would take almost 300 years to reach parity.
Table 2 (above) gives a more detailed look at the changes in inequality since 1930. While black people have outpaced white people in both increasing home value and homeownership, it has been only slight, and the gaps in both measures remain very large and show no immediate signs of shrinking significantly.
If homeownership translates into opportunity, it is evident that black opportunity in the South has remained limited, even as the social structure has been overturned again and again, seemingly for the better each time. It almost seems as if these numbers reveal a history where black Southerners, after almost literally starting from zero, have been forced to fight for stalemate. Even with legislative victories and social movement organization, black per capita home value has still not come close to that of their white counterparts, and the slow gains offer little optimism at the prospect of achieving real equality any time in the future without serious, dramatic social and legal change. This is a testament to an interrelated system of processes that operate to perpetuate inequality in the face of staunch resistance.
In addition to the aforementioned perniciousness of real estate appraisals, other systems serve to dampen black home value and homeownership despite the legal barriers to discrimination. At the very beginning of the home purchasing process, black people are met with resistance, as they are less likely to receive approval for loans than white people with comparable finances. Even if they can gain loan approval, numerous audit studies show that real estate agents tend to steer black people to black neighborhoods with relatively low property values even if they desire to live in an integrated neighborhood where they know their property values will be higher. If they somehow manage to secure a home in an integrated neighborhood, white families are often hyper-vigilant of the number of black families around them and begin to move out, following traditional white flight patterns. As those white families flee and are replaced by an increasing number of black families, municipal and commercial investment tends to decrease and the appraisal process begins again, deducting those black neighborhoods for lack of amenities and for simply being black.
If we are to successfully combat inequality contemporarily, we must continue to excavate the past to understand these processes and not only how they operated to maintain inequality at the time, but how they continue to shape inequality today. We must remember that the past is not the past. It is more than simply the bedrock of today, but the roots from which we sprang, directly shaping events in ways that we do not always completely understand. Once we come to terms with the many ways that inequality has been embedded and perpetuated historically, we can begin to develop best practices to not only trim the fruit at the top of the inequality tree, but dig deep to terminate the roots.


Comments