Throughout Chinatown Community Development Center’s 39-year history in San Francisco, we have grown to encompass multiple strategies in our quest for comprehensive community development. We are housing developers, organizers, neighborhood planners, service providers, youth workers, and more. In playing all of these roles, we accumulate a lot of data, but how, and more importantly, why?
For one, like all non-profits, we report to funders. CCDC records the work we do with every housing counseling client that comes through our doors. We also track all of the resident leaders that we work with to advocate for safe conditions in Chinatown buildings with residential units. Further, we’ve been tracking over 800 retail businesses in the core of Chinatown for five years.
In addition to using data to engage with funders, we hope the same data will enable us to take ownership of the stories of those who live and work in Chinatown. We want to proactively put forward a story of a thriving, bustling Chinatown to counter reports that Chinatown is losing relevancy.
Why is it important for us to collect and record data ourselves instead of relying on other sources? For a number of reasons, Census data doesn’t and never has, accurately represented our neighborhoods.
Language and cultural barriers, improper training in recording multi-generational households, and census workers’ unfamiliarity with Single Room Occupancy units are just a few challenges we face. Thus, population is consistently under-counted in official Census statistics for Chinatown. Lastly, collecting our own data lets us tailor the information to customize our programs to meet the needs of the neighborhood, in pursuit of our mission.
Like many nonprofits, we’ve struggled through a lot of different systems to keep our data over the years. The most common was Excel, which we all have on our computers and are familiar with using, but was becoming unwieldy. For the past two years we’ve been building our own database, which pulls together everything we already know from our work. This on-the-ground, local knowledge is our strength. We want to understand the impact of our programs and have data guide our strategies as the neighborhood changes over time.
Most buildings in Chinatown have retail on the ground floor with two or three stories of residential units above. Our database is organized building-by-building, and our proxy for this has been parcel number. Most of the time, there is only one building per parcel in Chinatown. We chose to build the database from scratch on Salesforce, using a “supervolunteer” (individuals who are generous with time and talented in skill) to set up the initial framework and then teach key staff how to add and modify. Our goal is to use it to create an “early warning system” for displacement and gentrification—what patterns do we see emerging? Are there more residential evictions on one corridor or with a specific kind of ground floor use?
Choosing a platform was not the most challenging part, but rather, it was the strategic project management of how to structure all of our data. It was a very iterative process, and we didn’t even come to understand the importance of the parcel number until one year into the work. One thing we did get right was having only one person be the point of contact with our volunteer consultant, as it funneled all of the thinking and problem solving to two people and enhanced our efficiency.
As of the beginning of 2016, we have recorded all the parcels in Chinatown and have integrated ground floor retail data with resident leader data. Our goal for 2016 is to integrate the housing counseling data and spend more time analyzing what we have.
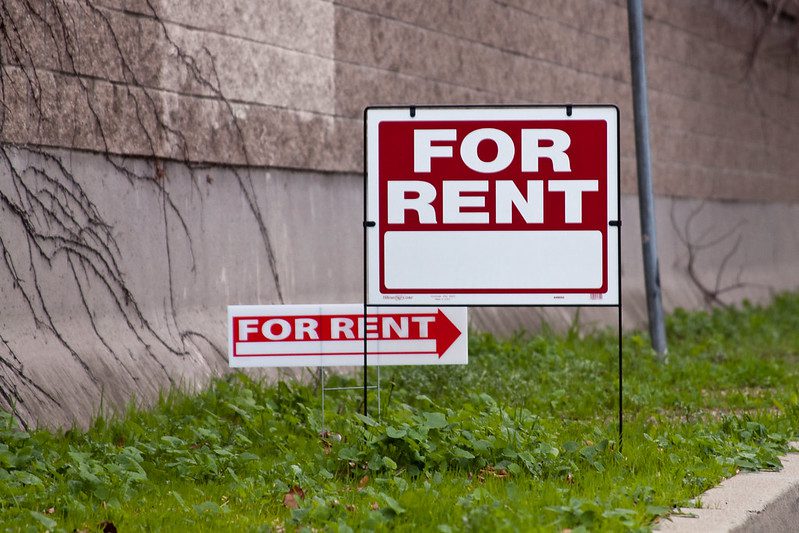
San Francisco, like many of the country’s major cities, is a hot real estate market where displacement and eviction pressures are at an all-time high. In light of this, we are adding a “watchlist” to the database and will continue to comb our data for trends.
Photo credit: ‘Chinatown, San Francisco,’ by duncan c via flickr, CC BY-NC 2.0)


Cindy,
Achieving this level of data collection is quite a feat, and I commend you and your team for taking the initiative. I’m curious, do you have any outside entity who will peer review your data to determine the significance of any observations you make? In other words, who will determine if observation X is evidence of a statistically significant trend or purely anecdote?
In general, I worry that we have done a poor job of taking the emotional nature of neighborhood change and allowing those emotions (fear, anger, skepticism, etc.) to shape our positions on everything from where we choose to live, who we think should live near us, what architecture is appropriate for our neighborhoods, who is to blame if someone moves out, and so on. Having strong, unbiased data is certainly the first step to counteracting our own inherent bias, and I’m glad to see organizations like yours taking the lead in your community.